Stock Advice

Nine years ago, Alade Olufemi cashed a N10.5 million cheque after winning the Lotto (Baba Ijebu).

A recent story says that Alade blew through all of his money and now survives on  “danfo”  which he uses as public transport system.

We’ve all read stories about lottery winners going from rolling in dough to being dead broke again. In fact, I recently read that 70 % of lottery  winners lose or spend all of their money in five years or less.

But it’s not just lottery winners that can’t hang on to their money.

There are people who seem to hit financial problems again and again. They get in a lot of debt, pay it off and somehow end up in major debt again.

Or you see the person who has an excellent start to a new opportunity, but then it suddenly heads south.

Why does this happen? Is it just bad luck?

The good news is that it has nothing to do with luck.

Today I’ll discuss 4 reasons why people can’t hold onto money .

No spending plan: Without a plan or financial goals, you’re headed down the road to digging yourself deeper into debt. A spending plan establishes goals and principles. If your goal is to save N1,000,000 for the next 5years, then you need to have a spending and saving plan.

Keeping up with everyone else. Your neighbor just pulled into his driveway with a new Ford Mustang, and you immediately think about buying the new Infiniti luxury sedan. That’s what we know as keeping up with the “Bigman”. But it doesn’t stop there. Your sister tells you she just picked up the latest purse in the Louis Vuitton spring line, and you think about that Chloe bag you didn’t really want until now.

Lack of discipline. Just as you begin to think about purchasing a new car because your neighbor recently bought one, hopefully you have enough restraint to consider the impact on your spending plan.

Buying a new car every few years. Remember the car your neighbor bought? Well, let’s just say you’re about six months from paying off your current vehicle, but you’ve now convinced yourself that it’s time to get a new car because “I deserve it.” This is a classic reason why so many people dig in and remain in debt.

Poor Money Management: Most of the time, poor budgeting invokes debt. You must have a monthly budget. Without a proper budget, you will not be able to track your expenses. If you write down your spending for an entire month you can see exactly where you money ends up. This is the best way to learn where you can cut some unnecessary expenses and help yourself avoid debt.

See you next time……. as we discuss

Please post your comment, suggestion and inquiry below.

85% of people lose their money in the stock market, hence Be part of the 15% who earn money 

by joining me in a 

Two days Comprehensive Stock Market Trading workshop tagged “The Path To Financial Independence “

The prolonged volatile and corrective mood of the market has caused many investors, including market players, to lose money in the global and domestic markets. This is due to the transition in the international economy that has slowed down growth in many economies following the unprecedented collapse of crude oil price.  Such economic slowdown calls for proactive economic managers and the political will to redirect the whole system to a progressive transformation that would boost confidence again in the market.

The nation’s bourse has been troubled with prolonged down market that eroded investor confidence as the economy is struggling to find its direction.

But with the government trying to champion a new course using the budget and other incentives expected to revamp the economy again, discerning investors and operators who understand market volatility and correction are timing and positioning for the up and down movement to benefit from the oscillation in a recovering market. These, coupled with the prevailing value the market has presented now, means that many fundamentally sound stocks are selling at a discount. Also, the expected plans and policy of government when implemented would impact on the system.


NSE sets to rebound, as profit taking and reaction to Brexit sell off declines

After recording a drop of N513.80 billion in the last three trading sessions as a result of profit booking and the Brexit reaction, the Nigerian Stock Exchange is showing signs of recovery.This stemmed from the fact that the rate of sell-off declined yesterday when compared with the other two trading sessions.
The buy position improved by 47 per cent as against Monday buy position of three per cent, while sell position dropped to 53 per cent from 97 percent sell position achieved in the previous trading day.

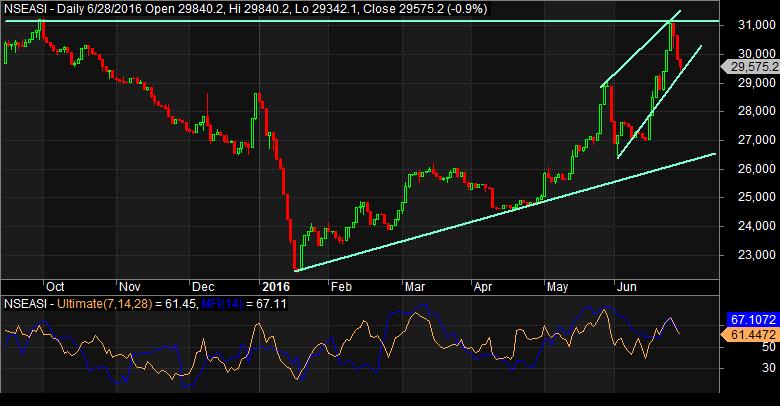
At the close of yesterday trading, the composite NSEASI shed 264.99 points to close at 29,575.24 from an opening figure of 29,840.23 representing 0.89 per cent decline due to panic selling by speculative investors and traders who were exiting for safety to protect their funds. Whereas others were taking advantage of the pull-back to position for end of the month activities due to account balancing by fund managers and other market players and earnings season expectations.

Market breadth for yesterday (Tuesday) was negative, as the number of decliners’ outweighed advancers in the ratio of 34:15 on a relatively small volume of selling position of 53 per cent and buying position of 47 per cent. Market capitalisation closed lower at N10.16 trillion from an opening value of N10.25 trillion losing N91.01 billion, representing a decline of 0.89 per cent. The bearish sentiment was reflected on the highly capitalised stocks that dominated the top 10 decliners. The NSEASI’s year-to-date return currently stands at 3.26 percent.

The volume of trades stood at 255.25 million shares in contrast with 361 million shares, a decline of 29 per cent from the previous day. Value of shares traded stood at N3.03 billion against N4.01 billion in the previous day, a decrease of 24 per cent drop from the previous trading level. Transactions in the shares of TRANSCORP, GUARANTY, FBNH, ZENITH and UBA topped the activity chart as most traded equities when measured in volume terms.

NSEASI and all sector indices closed in red except NSE Lotus that gained marginal 0.05 per cent and NSE Industrial Goods closed flat.

Despite the downward trend, our stock seasonality analysis showed that historically, July has remained a strong month for equity market returns, meaning that this pull-back is another opportunity to reposition when support level is insight for another bottoming out again. This is based on expectations of full-year scorecards for companies having March as full-year and June half-year earnings season being expected to start tickling in the market. Earnings for March year end is being expected this week and next week for Q2 earnings reports.

During the day under review, two companies made their belated full year earnings reports for 2015 available to the market, Royal Exchange Insurance and Union Dicon Salt Plc.

Technical Position of the market see below


NSEASI DAILY TIME FRAME

pixx

Technically, the market is strong on a long trend but weak on the current trend as a result of ongoing pullback, which the possibility of reversal at this point is high as volume traded is reducing with increasing buy position.  The recent correction after forming a double top, is likely to reverse since the pullback in the bullish channel has touched the lower line of the channel and retrace back on improved buy volume is a signal of reversal as mentioned above.

Looking at technical indicators, early all are still looking down especial the momentum indicators like RSI, Stochastic Oscillators and CCI are signaling sell except MACD that is indicating buy.  RSI is reading 60.14. MFI and Chaikin Money Flow have turn positive signaling entry of funds to the market again.


Market Outlook

Market is likely to reverse today on the strength of improving buy position in expectation of earnings release and rebound momentum of the global markets after two trading sessions of massive selloff triggered by Britons vote to leave EU.

Stocks to Buy

UBA, Ucap, FCMB, Zenith, GTBank, Redstar, Flourmill, 7up, Access and Transcorp.


The nation’s stock market recorded four straight weeks of bull-run, attributed to positive news within the periods that had rekindle investors interest and positive sentiment, despite profit booking on the part of traders. The recent reactions to the  news of President Muhammadu Buhari’s signing of the budget into law, hike in the price of petrol and deregulation of the oil and gas sector, coupled with the initial fund released for implementation of the budget  have push the market above the march resistance level to the beginning of the year position.

The composite index NSE ASI crossed the psychological line of 26,000 again on a strong volume, a good sign of a recoverying market. However, sustainability remains doubtful, since there are no strong fundamental change, improvement in the economy or in the market to support this rally, meaning pull back is imminent on the heel of profit taking.

The stocks in petroleum products marketing sector are enjoying immediate benefit from the deregulation of the price of Premium Motor Spirit and the hike in pump price on the back expected increase in margin enjoyed the marketers. This influenced others equities during the week, especially following media reports that government plans to remove subsidy on Monday. At the same time, the economic reality of the hike is that inflation rates would be pushed higher as general prices of goods and services have increased immediately after the pronouncent of the 67.63 percent increase in fuel price from N86.50 to N145 per liter. The expected increase in cost of living as a result of this hike will affect saving and investment despite the stock market hedge against inflation.

Before the hike, inflation rate was above the 12 percent MPR (same as  the interest rate, which suggests that MPR in the next CBN monetary policy meeting may likely go back to its high of 13 percent in the recent years, This means that money market instruments will become more attractive with less risk and funds will gradually start to flow into the stock market. Also we expect a faithful implementation of the budget to reverse the illiquidity in the system and usher in a progressive economy that will boost the nation’s fundamentals to attract local and foreign investors along the line.

Meanwhile, the global markets were mixed, during the week under review to reflect the disappointing earnings reports across the globe. The United States’ market was mixed, due to weak earnings and employment numbers release recently. This discouraging numbers have affected many equity indexes of the US market revealing the state of the economy and its recovery stage.

In Europe, stocks price are falling due to below expected earnings that were released although valuation remained cheap relative to US market. The economic recovery of China remain doubtful as reveal by the slower export and import numbers.

The Composite index NSEASI gained 739.43 points to close at 26,441.03 from an opening figure of 25,701.60 representing 2.88 percent growth. Similarly, market capitalisation for the period closed higher at N9.10 trillion from the opening value of N8.84 trillion. The leading index’s year-to-date returns stood at a negative 7.69 percent, while market capitalisation for the same period lost N678 billion.  The market breadth finished positive with more number of advancers that outweigh decliners in the ratio of 54 to 17.

The NSEASI opened the week’s trading session upbeat with 0.49 percent gains, it retreated into the negative region for the second and third trading sessions shedding 0.70 percent and 0.06 percent respectively. The trend however reversed on the fourth and last trading sessions with 0.91 percent and 2.23 percent.

The composite index NSEASI and other sector indices were in green except for NSEINDUSTR which dipped by 1.15 percent. The weekly market transaction levels measured by aggregate volume and value improved by 73.65 percent and 51.70 percent respectively in contrast to last week’s closing levels. In the week under review, a total of 1.83 billion shares valued at N14.47 billion were exchanged in 20,058 number of deals compared to 910.66 million  shares valued at N6.41 billion exchanged in 15,023 deals recorded in the previous trading week.

NSEASI WEEKLY TIME FRAME
New Picture 2

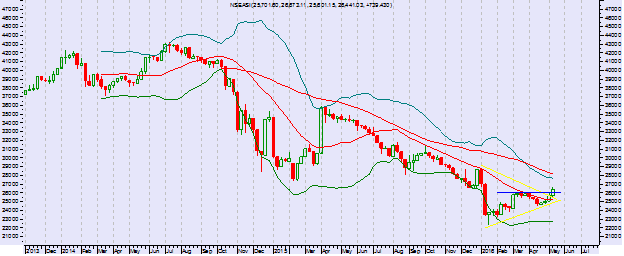
Technically, the market is strong and in a bull transition as it sustained the weekly up trend, trading above its weekly 20-day moving average at 26,441.03 but still below the 50-day moving average and at the same time breakout  the March resistance level to January 2016 position . This break out confirm a bullish market. The strong demand as reflected in the volume were as a result of market positive  reaction  to petrol price hike and initial disbursement of fund for implementation of 2016 budget, despite the gloomy situation of the economy. The break out of symmetrical triangle has confirm continuation of trend, depending on market forces as the market open this morning.

Looking at other technical indicators, NSEASI closed below the upper band by 25.6%. During the past 10 bars, there have been 6 white candles and 4 black candles for a net of 2 white candles.  During the past 50 bars, there have been 21 white candles and 29 black candles for a net of 8 black candles. MACD is currently bullish since it is trading above its signal line. The MACD crossed above its signal line 10 period(s) ago.  Since the MACD crossed its moving average, NSEASI’s price has increased 2.40% and has ranged from a high of 26,673.11 to a low of 24,181.51. RSI is reading 51.20 and appears neutral while MACD remains bullish uptrend since early May. Stochastic Oscillator are signaling buy while CCI are signaling sell.  Money flow index is indicating strong entrance of funds into the market


During the week under review, four companies share price were adjusted for dividend, Nestle Nigeria Plc, FBNH, Okomu oil and Nascon Ailled  Also, 4 companies released their first quarter earnings while 3 released full year earnings. They include: Unity Bank, International Breweries, PRESCO, Standard Alliance, SCOA Nigeria and C & I Leasing. Tiggerbrand PLC led the advancers chart with 50.13 percent gain, while the flip side was topped by University Press  with 14.21 percent decline.


Market Outlook

The market closed positively on increased investors sentiment boosted by news on hike fuel price and deregulation of oil and gas sector, coupled with the news of first disbarment of fund for implementation of 2016 budget. With less company news in form of earnings reports and profit taking expect mixed performance.   Investors should take advantage of the low prices to accumulate in stages, stakes in good companies with long term investment goals as first quarter earnings are revealing the earnings power of these companies.

STOCKS TO WATCH

 Lafarge Africa, Access Bank, Conoil, Mobil. CCNN , Zenith Bank, UBA, FBNH, Eterna, Honeywell and Livestock


REVIEW LAST WEEK STOCKS TO WATCH

The performance of equities recommended last week on this last week, Time is money and sending your money on an errand to work for you makes the difference in wealth creation and accumulation.  Any investment you can make 10 percent return in a week and does not take all your time is good for your to learn the secret and the risk of the  business and play along to grow your income to meet increasing needs and become financial independent.

Investdata weekly stocks to watch, always set 5-10 percent stop loss

Company Open Close % Change Remarks
Dangote Cement 168 165 -1.79 Wait
Zenith Bank 13.15 14.70 11.79 Run with Profit
UBA 3.40 3.63 6.76 Wait and watch trend
7up 145 145 Unchanged Wait
Livestock 0.80 1.00 25.00 Run with profit


If at the beginning of last week you invested N100, 000 into Dangote Cement, you would have made a loss of 1.79 percent including 2.1 percent transaction cost of buying.  Which if you wait for while in the stock with sell at a profit knowing the nature of stock and movement pattern.

Zenith Bank in one week is giving you a return of 11.79 percent which no investment window will give you in this short period of time, so will UBA has equally  given you 6.76 percent but you can wait to achieve the 10 percent after transaction cost.

If you are in 7Up you are not profit or losing you money but wait for factors that attracted you into the stock to influence the price

If you are in Livestock and you have made 20 percent in one week after cost of trading that is cool N20, 000 on N100, 000 investment meaning in you are sure of N40,000 if you move to another stock and make average of 7 to 10 percent in a week.  The good news is that a stock can grained 10 percent in day if market sentiment is in favor of that stock.  To learn how to invest profitable in the stock market call the numbers on second page down or visit our office.  Succeeding with your money is at your hand.

Theme–INVEST 2015 TRADERS & INVESTORS SUMMIT

Sub-Topics

o      Why some sectorial indices outperform the market and How to identify the Next sectoral Bulls, N2,500

o     Technical Analysis as guide to the best and right time to enter the stock market. N2500

o     Understanding Pre and Post-election stock market behaviour: How to make money from the trend N2,500


Theme—COMPREHENSIVE SHORT TERM TRADING WORKSHOP

Sub- Topics

o    Identifying “ BUY & SELL” signals before the market( Using TA indicators & Chart patterns)N2,500

o    Maximizing Profit in equity market using Earnings release date to trade. N2,000

o    The best strategies for screening stocks for short term trading/ positioning N2,500


Theme—Trading Strategies for Wealth creation & Cashflow in the Nigeria Stock Market

Sub-Topics

o          How to filter market noise and identify the direction of smart money in the market and specific stocks( Using TA) N2,500

o          How to make money in equity investing (Using TA to Enter, Exit and Manage Money.N2,500

o          How to generate income from the changing stock market( Using TA indicators & others)


Theme—Get “The Key” to higher returns in a Transforming Market

Sub-Topic

o    Strategies to dominate the market and how to pick good stocks in a transforming market N2,500

o    Portfolio Selection guide for Retirement and at Retirement N 2,000

o    How to identify a major move before it happens ( Using Technical Analysis) N2,500

Investing with dates to create cashflow through dividend income and capital growth. N2,000

Theme— Dynamism of Today Equity Trading in the Frontier Market

Sub-Topic

o    Understanding how the “Real World” Impact chart reading for Profitable Investing & Trading. N2,500

o    Timing the market for short positioning & exit, Using TA to identify the accumulation, distribution and mark-up stage of the market/specific stock N2,500

o    How to combine Fundamentals & Technical analysis in buying and selling equity for higher returns. N2,000

o    Theme—INVEST 2014 TRADERS & INVESTORS SUMMIT

o    Sub-Topics

o    o   The Power of Earnings in equity Investment & Selection N2,500

o    o   Strategies for Profitable equity Trading in the new market structure N2,000

o    o   Nigerian Smart Money Trading strategy Revealed Using Technical Analysis N2,500

o    o   How to use Technical Analysis to shop for Profitable equities in 2014 and Beyond N2,500


Bank details


Investdata Consulting Ltd,

Zenith Bank,

Account number

1013033032

Call: +234 802 816 4085


Delivery by DHL courier service, within 24 hours in Lagos and outside 48 hour after payment confirmation.

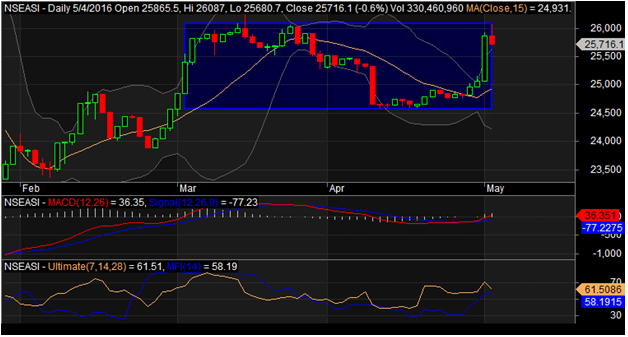
The Nigerian equity market  closed in the red after  strong intraday move and the  three trading sessions of bull run, that was attributed to portfolio managers repositioning of their accounts for the month April, retention of the nation securities in the international emerging market index and positive reaction to Nestle Nig plc first quarter impressive earnings report. The marginal pullback on a strong volume is a signal that the bullish upbeat is getting weak.

The Composite index NSEASI shed 150.08 points to close at 25,715.42 from an opening figure of 25,865.50 representing 0.58 percent decline. Similarly, the market capitalization lost N51.62 billion to close at N8.85 trillion as against opening value of N8.99 trillion. The market breadth was still upbeat as the number of advancers outweighs decliners in the ratio of 26 to 19.

The volume of trades were up to stood at 330 million shares as against  previous days  220 million shares, representing  50.14 percent increase  while value recorded N2.26 billion as against N1.50 billion previous day trading level, representing 50.48 percent  improvement in value. Transactions in the shares of FBNH, UBA, FIDELITY, DIAMOND and ZENITH topped the activity chart as most traded equities as measured by volume.  The leading index NSEASI and all sector indices closed in red except for NSECNSMRGDS which improved by 0.21 percent while NSEASEM closed flat.  Market forces in today trading will determine the next swing.

NSEASI DAY TIME FRAME

stock2


Technically, the bullish run is becoming weak as the market is struggling to breakout the March strong resistance level, this may be a sign of reversal as the index touched the 26,000 benchmark before dropping to close lower on a huge volume.

NSEASI closed above the upper band by 0.9%.  Although prices have broken the upper band and an upside breakout is possible, the most likely scenario is for the current trading range that NSEASI is in to continue.  Making the picture somewhat unclear is the fact that Bollinger Bands are 40.93% narrower than normal.  The narrow width of the bands suggests low volatility as compared to NSEASI’s normal range.  Therefore, the probability of volatility increasing with a sharp price move has increased for the near-term.  The bands have been in this narrow range for 5 period(s).  The probability of a significant price move increases the longer the bands remain in this narrow range.


Currently the MACD is bullish since it is trading above its signal line. The MACD crossed above its signal line 3 period(s) ago.  Since the MACD crossed its moving average, NSEASI’s price has increased 3.01%, and has ranged from a high of 26,087.04 to a low of 24,806.05. The current value of the RSI is 64.25. Other technical indicators like SO and CCI are reading overbought, signaling sell position. MFI is still indicating that funds are entering the market.


Traders should trade with caution while investor’s position taking at this point should be for long term or wait to know the market direction as profit taking will remain upbeat.

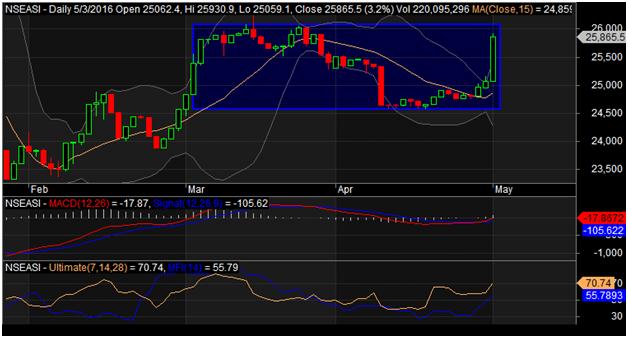
Trading on the floor of the Nigerian Stock Exchange closed positively to usher in the new month of May as the three straight days of bull transition in bear market continued on the strength of price appreciation of highly capitalized stocks especially as investors react positively to Q1 earnings report of Nestle Nigeria Plc to further push the Composite index into green.  Investors should be very careful to jump into position now as profit takers and traders exiting the market are selling on a seemingly strong market, if any position at all should be for the long term perspective in case there is a reversal. The possibility of pull back is imminent as investor confidence and economic fundamentals are still shaking as oil price has reverse downward again. The Composite index NSEASI gained 803.09 points to close at 25,865.50 from an opening figure of 25,062.41 representing 3.20 percent improvement on capital gain of  NESTLE, DANGCEM and NB. In similar direction, market capitalization gained 3.2 percent to close at N8.99 trillion from opening value of N8.72 trillion. Leading index NSEASI year to date returns is currently at negative 9.69 percent while the market capitalization for the same period had lost N933.35 billion.

The market breadth was in favor of the bulls as the number of advancers outpaced the decliners in the ratio of 33 to 12 on a marginal decrease in volume and value. The volume of trades stood at 220 million shares in contrast to 229 million shares representing 4 percent decline while value recorded N1.50 billion as against N1.50 billion, representing 0.03 percent drop from their previous trading levels. Transactions in the shares of ACCESS, FCMB, FBNH, ZENITH and FIDELITY topped the activity chart as most traded equities as measured by volume. NSEASI and all sector indices closed in the green except for NSEOILGAS which shed 3.56 percent while NSEASEM remains unchanged.

NSEASI DAILY TIME FRAME

stock


Technically, the market is strong as blue chip stocks that had suffered price decline responded to the strong sentiment of the market as Nigeria securities were retained on the international market index MSCI after proposing to delist Nigeria from the frontier index at the end of last month. Lead Indicator approaching March resistance line is good, any breakout at this point will confirm strong recovery and bull ascendancy. But, the probability of the market pulling back is high.

NSEASI closed above the upper band by 16.2%.  Although index have broken the upper band and an upside breakout is possible, the most likely scenario is for the current trading range that NSEASI is in to continue. Making the picture somewhat unclear is the fact that Bollinger Bands are 44.73% narrower than normal.  The narrow width of the bands suggests low volatility as compared to NSEASI’s normal range.  Therefore, the probability of volatility increasing with a sharp price move has increased for the near-term.  The bands have been in this narrow range for 4 period(s).  The probability of a significant price move increases the longer the bands remain in this narrow range.

Currently the MACD is bullish since it is trading above its signal line. The MACD crossed above its signal line 2 period(s) ago.  Since the MACD crossed its moving average, NSEASI’s price has increased 3.61%, and has ranged from a high of 25,930.86 to a low of 24,806.05.  RSI is currently reading 68.80 while other technical indicators like Stochastic Oscillator and CCI are reading overbought, signaling sell.


Traders and Investors should watch their earlier positions to know if target set are met so that they can exit position in profit while new positioning should wait and watch today outcome of the market.

At the end of midweek trading the Nigerian Equities market slide back marginally to close in the red reversing the previous day gain on increased volume of trades.  The Composite index NSEASI shed 14.57 points to close at 24,809.29 from the opening number of 24,823.86 representing 0.06 percent decline. The market had a mixed sentiment as mentioned in our earlier analysis revealed by market indices and price depreciation of high cap stocks like Dangote Cement, NB, Total, FO and GSK. In the same vain, the market capitalization shed N5.02 billion to close at N8.53 trillion from opening value of N8.54. The composite index NSEASI year to day returns is currently at a negative 13.38 percent while the market capitalization for the same period had lost N1.32 trillion.

The market breadth was negative as the bear took over with the number of decliners outpacing that of advancers in the ratio of 22 to 19.  The volume of trades stood at 285 million shares in contrast to 212 million shares, representing 34 percent improvement from the previous day close.  On the other hand, the value of trades recorded N1.35 billion as against N1.50 billion, representing 10 percent decline from the previous trading level. Transactions in the shares of ACCESS, FBNH, UBA, WEMA and FCMB topped the activity chart as most traded equities as measured by volume.

The leading NSEASI and all sector indices recorded a decline except for NSEBNK, NSEPENSION and NSEPREMIUM which were up by 0.44 percent, 0.42 percent and 0.29 percent respectively. The banking stocks dominating the activity chart in the two trading days reveals how marketable the sector equities are for traders. The impressive numbers from the oil & Gas and positive moves of crude oil price in the international market have not supported its share price yet, as price depreciation in industry shares propelled yesterday market decline.

NSEASI DAILY TIME FRAME

The little pull back of NSEASI yesterday on improved volume suggests that the two remaining trading days of the month of April may experience positive rally depending on strength of the numbers that will be released this period, the mixed performance of companies scorecards that hit the market yesterday also contributed to the pullback.  The market is still below its 20 and 50 day moving average but the two averages crossing over signals reversal. MACD red line also crossing the blue line from below is a positive reversal signal too. Today trading will finally confirm break down or reversal.  With the symmetrical triangle chart pattern of the market which is a continuation or reversal, the market is likely to continue to look down as profit taking for end of the month may support down trend unless there is positive news as the market opens or during trading.

Currently the MACD is bearish since it is trading below its signal line. The MACD crossed below its signal line 22 period(s) ago.  Since the MACD crossed its moving average, NSEASI’s price has decreased 3.60%, and has ranged from a high of 26,026.48 to a low of 24,569.72. RSI is currently reading 42.96, as CCI and MACD signaled buy but Stochastic Oscillator is signaling sell. MFI is indicating that funds are leaving the market already

MARKET NEWS

Diamond Bank Plc yesterday made available its belated financial result for the year ended 31st December, 2015. Going by the details of the result, investors will have to go home with a zero reward, this is due to the N55.17 billion Net Impairment Loss on Financial Assets recorded by the bank during the reported year. This jacked down the full year earnings to N5.65 billion against the N25.48 billion earned in 2014. Others companies that released its quarterly earnings reports to the market are Mobil Oil, Livestocks feeds, Wema Bank, Nahco, Fidson, Portland Paints, Morison Industries, and Tourist Company of Nigeria

OTHER MARKET PERFORMANCE INDEX

Index Open Close %Change
ASI 24,823.89 24,809.29 -0.06
NSE 30 1090.89 1,088.35 -0.23
NSE BNK 230.50 231.52 0.44
NSE- INSURANCE 132.55 132.46 -0.07
NSE CONSUMER 588.25 588.16 -0.02
NSE OIL & GAS 337.72 330.58 -2.11
NSE LOTUSUM 1,683.99 1,679.60 -0.26
NSE INDUSTRY 1882.70 1,882.54 -0.01
NSE PREMIUM 1,546.44 1,550.93 0.29
NSE PENSION 713.81 716.81 0.42
NSE MAINBOARD 1,118.22 1,115.10 -0.22
       
MCAP  (N’trillion) 8.54 8.53 0.06


TOP 5 ADVANCERS & DECLINERS FOR THE DAY

Company Open  Close %Change Remarks
FBNH 3.39 3.57 5.31 Market Forces
Unilever 29.25 30.71 4.99 Impressive Q1
Diamond Bank 1.42 1.49 4.93 Market forces
Honey Flour 1.42 1.49 4.93 Q4 Expectation
Eterna 2.04 2.14 4.90 Market forces
    DECLINERS    
GSK 24.97 22.55 -9.69 Price Correction
UACN Property 4.45 4.03 -9.44 Unimpressive Q1
Nahco 4.00 3.80 -5.00 Unimpressive Q1
FO 250 237.5 -5.00 Profit Taking
Total 147 140.06 -4.72 Market forces


Market Outlook

The market is likely to continue on the down trend due to profit taking and the possibility smart traders going away in May to come later in August.  Let the first quarter earnings guide your entry and exit, as some companies have outperformed the economic on the strength of their earnings for Q1.


STOCKS TO BUY

Africa Prudential, Fcmb, Access Bank, Uba, Dangote Sugar, and NEM Insurance

There is profit taking in Dangote sugar now, NEW positioning should wait.

Profit Taking will hit Africa Prudential any moment from today wait to buy later,

Trading activities on the floor of the Nigerian Stock Exchange closed positively to reverse the two days bear run on the strength of price appreciation of highly capitalized equities like FBN Holdings, Zenith Bank, Nigerian Breweries and GTBank.  The composite index NSEASI gained 59.74 points to close at 24,823.86 from an opening figure of 24,765.10 representing 0.24 percent growth on improved demand for shares. The market capitalsiation gained N20.22 billion to close at N8.54 trillion representing 0.24 percent increase in value. NSEASI year to date returns is currently standing at a negative 13.33 percent and for the same period market capitalization had lost N1.31 trillion.  The first quarter earnings reports that hit market recorded mixed performance with Total Nigeria beating market forecast while FBNH is relatively okay knowing the position the bank going from to start on a slate.  UACN and its holdings company’s earnings reports in recent time have been below market expectation which the market is likely to treat the group accordingly.

The market breadth closed positive as the number of advancers outweighs decliners in the ration of 22 to 8 on a strong volume indicating smart money portfolio repositioning for the month ending this Friday.    The volume of trades stood at 212 million shares in contrast to 144 million shares traded in the previous day represent 47percent improvement while value recorded N1.50 billion as against N770 million  representing 96 percent increment from the previous trading value.  Transactions in the shares of ACCESS, FBNH, ZENITH, UBA and FCMB topped the activity chart as most traded equities as measured by volume.

The leading index NSEASI and all other sectorial indices closed in the green expect for NSEINDUSTR that shed 0.02 percent.

NSEASI DAILY TIME FRAME

NSEASI reversed yesterday on improved volume as triggered by seemingly positive earnings reports that were released to the market.  The market is still below its 20 and 50 day moving average but the two averages crossing over signals reversal. MACD red line also crossing the blue line from below is a positive reversal signal too.  With the symmetrical triangle chart pattern of the market which is a continuation or reversal, the market is likely to continue in the uptrend but profit taking for end of the month may pullback the trend.  Currently the MACD is bearish since it is trading below its signal line. The MACD crossed below its signal line 21 period(s) ago.  Since the MACD crossed its moving average, NSEASI’s price has decreased 3.54%, and has ranged from a high of 26,026.480 to a low of 24,569.7. RSI is currently reading 43.39, as CCI and MACD signaled buy but Stochastic Oscillator is signaling sell.

MARKET NEW

The management of First Bank Holding yesterday made available the belated full year financial position for the year ended December 31st, 2015 along with its first quarter of 2016 result.  The bank directors are recommending a 15k dividend. Other companies that released their scorecards are UACN Plc, UACN Property Plc, Total Nigeria Plc, and Berger Paints.  The Brent crude oil price yesterday sustained it rally to close at $45.84 per barrel.

OTHER MARKET PERFORMANCE INDEX

Index Open Close %Change
ASI 24,765.10 24,823.89 0.24
NSE 30 1087.89 1090.89 0.28
NSE BNK 228.43 230.50 0.91
NSE- INSURANCE 131.05 132.55 1.14
NSE CONSUMER 587.17 588.25 0.18
NSE OIL & GAS 336.6 337.72 0.33
NSE LOTUSUM 1,682.57 1,683.99 0.08
NSE INDUSTRY 1,883.04 1882.70 -0.02
NSE PREMIUM 1,543.30 1,546.44 0.20
NSE PENSION 712.04 713.81 0.25
NSE MAINBOARD 1,115.27 1,118.22 0.26
       
MCAP  (N’trillion) 8.53 8.54 0.24


TOP 5 ADVANCERS & DECLINERS FOR THE DAY

Company Open  Close %Change Remarks
Cutix 1.32 1.42 8.33 Market Forces
HoneyFlour 1.35 1.42 5.19 Q4 Expectation
AG Leventis 0.82 0.84 4.88 Market forces
Mansard Ins 2.14 2.24 4.67 Q1 Expectation
Trans Express 1.13 1.18 4.42 Market forces
    DECLINERS    
Berger Paints 9.30 8.84 -4.95 Unimpressive Q1
Air services 1,72 1.64 -4.65 Market forces
Stanbic IBTC 14.30 13.76 -3.78 Market forces
Guinness 97 95 -2.00 Unimpressive Q3
UBA 3.41 3.38 -0.88 Market forces


Market Outlook

The market is likely to slow down as traders will be taking profit while new investors are positioning with first quarter earnings report. This expected mixed sentiment on the floor will finally determine the market direction.  Let the first quarter earnings guide your entry and exit, as some companies have outperformed the economic on the strength of their earnings for Q1.


STOCKS TO BUY

Africa Prudential, Fcmb, Access Bank, Uba, Dangote Sugar, and NEM Insurance.


Foremost Nigerian Insurance Company, NEM, recently released its first quarter earnings report for the period ended March 31 to the investing community, and the numbers were significantly up as the company’s top and bottom lines pointed to the north direction. It is obvious that the insurer is strongly consolidating its performance to create more value for stakeholders, comparing the current scorecard to the 2015 numbers of the same period.  Gross Premium was higher, when compare to 2015 first quarter, just as profit for the period increased by a significant 64 percent from N1.39 billion in 2015 to N2.29 billion. Shareholders’ fund growth was sharp at 37 percent, closing at N8.49 billion from the previous first quarter’s N6.21 billion.

Earnings per share estimates improved from the said Q1 figures to N0.43 as against N0.26 in the comparative period of 2015, surpassing the company’s 2015 full year EPS, following which investors’ waiting period crashed to 0.44x from 0.67x. The said Earnings yielded 56.36 percent of the current market price, well above the 37.28 percent yield estimated in 2015.

Please note that the full year earnings is estimated at trailing EPS of N0.35 and above, because this company is good in posting impressive quarterly earnings but at the end of the year the earnings are lower than the quarterly figures. As revealed by the company’s full year earnings, quarterly results are not fully representative of end of the year numbers. Also, it is becoming a norm in its industry that management account trend differs from the full year earnings of the companies. As the company’s assets base is increasing, the figure posted also reflect the commitment of NEM management to turn its assets into profit that would drive share price above the resistance level.

NEM INSURANCE
FIRST QUARTER
COY 2015 2016 % Chg
(N) (N)
Date Released                        October 21, 2015 April 22, 2016
Price @ Released Date 0.71 0.76
Gross Premium  3,480,730,000  4,013,041,000 64
Profit After Tax                  1,139,520,000               2,291,605,000  

   36

Shareholders’ Fund   6,207,334,000   8,498,942,000 26.53
Dividend
ESTIMATED RATIOS
Earnings Per Share 0.26 0.43  


PE Ratio                          0.67                   0.44  
Earnings Yield 37.28                   56.36  
Book Value 1.18 1.61  
Price to Book 1.66 2.09  
ROE 22.53 26.00  
Profit Margin 40.15                    57.10
Year End Dec Dec

SOURCES: COMPANY DATA & INVESTDATA RESEARCH


Valuation/Recommendations

On the strength of the previous full year book value of 1.17 and the first quarter EPS of 43 kobo,  NEM Insurance is set to rally above any resistant while the 3-months Book Value (BV) was estimated at N1.61 which is almost same as the trailing BV of N1.65. Price to Book Value (PBV) currently stands at 2.09 as at the end of first quarter of 2016.

Judging by the projected EPS of 0.35 for the full year 2016, the share price of NEM Insurance is technically placed at N1.65. The constant dividend payment and improving profit margin ratio reveal management’s proactiveness and cost efficiency.  Traders and investors should look the way of the stock as performance and profitability ratios are becoming stronger and a good start off for the new financial year. Our opinion is that investors and traders should take position,

History           

NEM INSURANCE PLC started insurance business in Nigeria in 1948 through the agency of Edward Turner & Co.  It became a Nigerian branch of NEM General Insurance Association Limited of London in 1965. Incorporated in 1970 as a Nigerian company in compliance with the Companies Decree of 1968, the company became quoted on the Nigerian Stock Exchange in 1989 following the privatisation exercise of the Federal Government of Nigeria. The company has expanded its operations into the West African Sub region, with the successful registration and commencement of business by its subsidiary, NEM INSURANCE (GHANA) LIMITED in May, 2009. N.E.M. Insurance Plc provides general and non-life insurance.

NEM Insurance
Share Holding Structure
Jeidoc Limited 6.98%
Bukson Investment Limited 6.38%
Other Statistics
 Shares Outstanding (MN) 5,280,502,913
Opening Price (2016) N0.66
Closing Price as @ April  22, 2016 N0.68
Date Listed 5th September, 1990
Year End 31st December

SOURCES: COMPANY DATA & INVESTDATA RESEARCH

Earnings Performance

The leadership of NEM Insurance has recently complied with its post-listing requirement to enhance its corporate governance. If this is sustained, going forward, the investing public’s perception of the company will be enhanced. This company’s gross premium performance for the five years was mixed as it grew significantly from N8.38 billion in 2011 to N10.90 billion in 2015 representing 30 percent rise for the period. On the other hand, Profit for the period shows that the company recorded a growth of 181.77 percent from N253.29 million in 2011 to N713.70 million after hitting a ‘high’ of N1.53 billion in 2014, the retained earning has helped NEM to meet the dividend expectation. Its profitability ratio has been unstable to reflect the prevailing situation in the economy.  The year 2011  seem to be the start of  rebuilding it bottom line in oscillating trend after it had recorded appreciable growth of almost 50 percent in 2012 and a drop of 11 percent in 2013 before recording a geometric growth of 286 percent in 2014, before slipping in 2015 to N713.70 million, representing a 53.21 decline from 2014 figure. The projection for the full year performance of 2016 full year score card is high,  as the company had turned a new leaf which it would likely sustain, added to the strong start for 2016 financial year.

Total equity/shareholders’ funds was slightly stable and looking up within the observed years, rising by 48 percent to N6.20 billion  from N4.19 billion in 2011, after it had recorded a high of N6.87 billion in 2014. Although this is encouraging, the management needs to make frantic efforts to consolidate the figure, so as to improve cogent ratios necessary in the valuation of the firm. Its consistent dividend payment for the last five years has made its share price relatively above 70 kobo, despite the downturn in the markets and economic situation.

NEM INSURANCE FOUR YEARS FINANCIAL PERFORMANCE  
2011 2012 2013 2014 2015
Date Released Tuesday, April 16, 2013 Monday, April 28, 2014 Monday, Oct. 27, 2014 March, 20, 2015  April 11 2016
Price @ Released Date 0.50 0.50 0.73      0.84 0.74
Gross Premium 8,381,196,000 9,652,556,000    8,933,345,000   9,266,749,000 10,895,711,000
Profit After Tax 253,294,000 455,312,000      395,060,000      1,525,301,000     713,702, 000
Shareholders’ Fund 4,185,328,000 4,316,427,000 4,695,693,000    6,865,777,00     6,199,362,000
Dividend 0.05 0.06 0.06           0.06           0.06

SOURCES: COMPANY DATA & INVESTDATA RESEARCH

Profitability Ratios

The company’s earnings power, currently stands at N0.14k, which is about 16 percent of its market value. The said earnings could account for 5.77x of the price at released date and have been estimated to yield 17.35 percent of the price. Please note the fluctuations recorded year on year in PE/Ratio and Earnings Yield. Estimated Ratios shows that the return made on equity ranges between 22 percent and 6 percent with the return at 12 percent in (2015). While the reported Profit for the year was estimated at 6.55 percent of the Gross Premium (2015) and have ranges between the high of 16.46 percent and other years profit margin are not encouraging, because the numbers are low.

                              NEM INSURANCE- ESTIMATED RATIOS  
2011 2012 2013 2014 2015
Earnings Per Share 0.05 0.09 0.07 0.29 0.14
PE Ratio 10.42 5.80 10.16 2.91 5.77
Earnings Yield 9.59 17.25 9.84 34.39       17.33
Book Value 0.79 0.82 0.89 1.30 1.17
ROE 0.06 0.11 0.08 0.22       0.12
Profit Margin 3.02 4.72 4.42 16.46       6.55
Year End Dec Dec Dec Dec Dec

SOURCES: COMPANY DATA & INVESTDATA RESEARCH

Powered by WishList Member - Membership Software