The Nigerian equity market closed in the red after strong intraday move and the three trading sessions of bull run, that was attributed to portfolio managers repositioning of their accounts for the month April, retention of the nation securities in the international emerging market index and positive reaction to Nestle Nig plc first quarter impressive earnings report. The marginal pullback on a strong volume is a signal that the bullish upbeat is getting weak.
The Composite index NSEASI shed 150.08 points to close at 25,715.42 from an opening figure of 25,865.50 representing 0.58 percent decline. Similarly, the market capitalization lost N51.62 billion to close at N8.85 trillion as against opening value of N8.99 trillion. The market breadth was still upbeat as the number of advancers outweighs decliners in the ratio of 26 to 19.
The volume of trades were up to stood at 330 million shares as against previous days 220 million shares, representing 50.14 percent increase while value recorded N2.26 billion as against N1.50 billion previous day trading level, representing 50.48 percent improvement in value. Transactions in the shares of FBNH, UBA, FIDELITY, DIAMOND and ZENITH topped the activity chart as most traded equities as measured by volume. The leading index NSEASI and all sector indices closed in red except for NSECNSMRGDS which improved by 0.21 percent while NSEASEM closed flat. Market forces in today trading will determine the next swing.
NSEASI DAY TIME FRAME
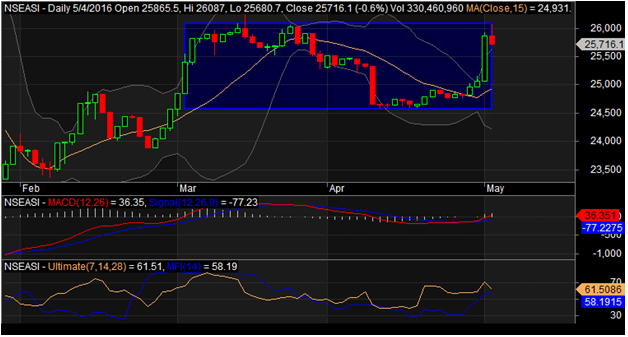
Technically, the bullish run is becoming weak as the market is struggling to breakout the March strong resistance level, this may be a sign of reversal as the index touched the 26,000 benchmark before dropping to close lower on a huge volume.
NSEASI closed above the upper band by 0.9%. Although prices have broken the upper band and an upside breakout is possible, the most likely scenario is for the current trading range that NSEASI is in to continue. Making the picture somewhat unclear is the fact that Bollinger Bands are 40.93% narrower than normal. The narrow width of the bands suggests low volatility as compared to NSEASI’s normal range. Therefore, the probability of volatility increasing with a sharp price move has increased for the near-term. The bands have been in this narrow range for 5 period(s). The probability of a significant price move increases the longer the bands remain in this narrow range.
Currently the MACD is bullish since it is trading above its signal line. The MACD crossed above its signal line 3 period(s) ago. Since the MACD crossed its moving average, NSEASI’s price has increased 3.01%, and has ranged from a high of 26,087.04 to a low of 24,806.05. The current value of the RSI is 64.25. Other technical indicators like SO and CCI are reading overbought, signaling sell position. MFI is still indicating that funds are entering the market.
Traders should trade with caution while investor’s position taking at this point should be for long term or wait to know the market direction as profit taking will remain upbeat.