The global financial market crisis that was propelled in recent years by the crash of crude price in the international market, added to the ongoing currency war are today crippling the banking system of many countries.
This has resulted primarily from the exposure of the banks to financing of oil business at a time the earnings power of the industry is declining helplessly due to low prices of crude.
Without doubt, the banking industry of any economy remains its engine room for growth and development. For this reason, every nation keeps tabs on the health of its banking institutions as any fundamental defects in this strategic sector could destabilize the entire economy, system and in fact, the government.
This is one major consideration that informed the periodic consolidation exercise in the banking industry of any nation to make it robust and healthy as approved by the central bank and other regulatory bodies. In our own case, such agencies also include the Nigeria Deposit Insurance Corporation (NDIC) and the Securities & Exchange Commission (SEC) which help to ensure the banks remain healthy and sound enough perform their obligations to the economy, besides protecting the banking public.
The banking reforms that took place between 2009 and 2011 to save banks in Nigeria from systemic failure helped to solidify the industry’s fundamentals, besides boosting the confidence of stakeholders, including local and foreign investors as banks earnings power were improved.
To underscore the importance of the health of banks, one only needs to x-ray the recent financial emergencies that engulfed Greece, China and the United States, leading to a battle of whether to hike or cut interest rate to avoid another deflation. The economic pressure on these countries was blown into the open as the leading indicator of any economy the stock market had become volatile when the prices of many listed companies continued to nose-dive, an indication that some of these big economy had been under pressure. As would be expected, this suddenly gave way to what we are seeing in the global financial market today. Added to this is the ongoing transition in the global and domestic economies, which has resulted in serious challenges in the monetary and fiscal policies of many nations.
Investors had lost huge amounts of money investing in banking stocks while depositors are now building tents with only banks they have confidence in. This is in their bid to avoid being caught in the web of what appears another global financial crisis that might lead to a great depression which also will affect the political and economic activities of many countries.
Already too, many industrialized nation of the world that were affected are being dictated by the circumstances surrounding their financial crisis and currency war. Banks’ health can be that important.
In Nigeria, our banks have remained resilient and healthy, such that the central bank has vouched for their soundness. That notwithstanding however, some informed persons and institutions, including international agencies, have voiced concern. Their worry, despite the regulatory assurance remains that just like the stress-testing of 2009 revealed, many of the nation’s banks todat are highly exposed to oil and gas businesses which might affect their fundamentals. Foe instance, it is argued that there were only two stocks that recorded dividend increment in the banking sector, one was flat and others either suffered a cut in their payout or did not pay at all for the year ended December 2014.
But where do the banks really stand today? It is the bid to unravel this mystery that has kept many investors on their toes, while our research team embarked on this. special report to highlight the strengths of those banks that stand out as fundamentally sound players to be published soon.
For depositors and investors, especially those with long-term objectives, certain areas of strength or fundamentals of a bank are very critical for consideration. They need to know such before taking investment decisions or lodging their money in banks. Some of these include the banks’ financial strength as can be gathered from: their shareholders’ funds, size of deposits, gross income, asset base, and profit after tax. No less important are factors like management style and risk management, among others.
All the consolidation exercises in the industry had helped to strengthen Nigerian Banks, making it possible for them to withstand the harsh effect of the global meltdown. Even then, the enormous headwinds facing the banks have exposed them to high volatility in earnings and price performance, in this high risk environment of uncertainties in the financial sector and the economy at large.
It is not certain how much this has affected the banks but the banking and investing public remain skeptical, seeking to know the best banks and the worst obanks among the pack.
They are presented in this report with respect to the latest September 2015 data and the price action of the banks. Investors should become more discerning about where to invest their funds profitably in 2016 as we expect this economic slow down to linger, in the absence of visible concrete efforts and a strategic economic blueprint to reverse the present trend.
Banking Sector Quick Data
|
Banking Sector Q3 2015 Data |
|
|
Gross Earnings |
PAT |
Net Assets |
EPS(N) |
Bad Loans (Prov) |
Retained Earnings |
| Unity Bank |
49,200,862,000 |
9,313,054,000 |
86,124,033,000 |
0.19 |
nil |
-47,121,428,000 |
| FBN Holdings |
390.896,000,000 |
50,217,000,000 |
576,524,000,000 |
1.47 |
46,638,000,000 |
153,983,000,000 |
| ETI |
411,833,393,000 |
60,416,836,000 |
528,178,039,000 |
3.29 |
34,673,926,000 |
N/A |
| Diamond Bank |
122,695,460,000 |
15,967,300,000 |
224,613,721,000 |
0.68 |
19,490,387,000 |
48,780,004,000 |
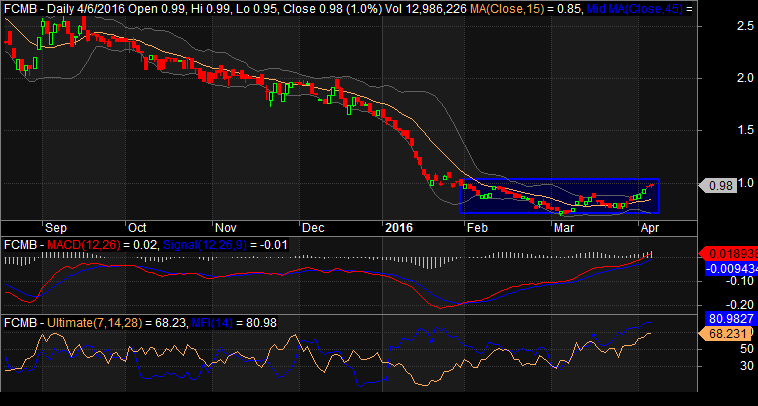
| FCMB Holdings |
109,294,240,000 |
1,865,624,000 |
158,358,166,000 |
0.13 |
15,287,296,000 |
N/A |
| Stanbic Holdings |
104,418,000,000 |
13,562,000,000 |
117,754,000,000 |
1.10 |
12,489,000,000 |
42,908,000,000 |
| Access Bank |
257,590,000,000 |
48,093,000,000 |
351,962,000,000 |
2.01 |
11,551,000,000 |
N/A |
| Zenith Bank |
336,853,000,000 |
83,087,000,000 |
571,501,000,000 |
2.64 |
9,725,000,000 |
203,891,000,000 |
| GTBank |
229,372,453,000 |
75,160,044,000 |
400,669,203,000 |
2.55 |
8,515,604,000 |
N/A |
| Skye Bank |
129,238,000,000 |
11,983,000,000 |
145,153,000,000 |
0.86 |
6,398,000,000 |
N/A |
| UBA |
247,205,000,000 |
48,557,000,000 |
322,558,000,000 |
1.43 |
5,395,000,000 |
116,623,000,000 |
| Sterling Bank |
81,811,576,000 |
7,547,592,000 |
704,346,226,000 |
0.34 |
5,237,873,000 |
N/A |
| UBN |
84,719,000,000 |
9,337,000,000 |
233,143,000,000 |
0.55 |
4,454,000,000 |
-249,671,000,000 |
| Fidelity Bank |
106,570,000,000 |
11,445,000,000 |
180,339,000,000 |
0.40 |
3,940,000,000 |
17,953,000,000 |
| Wema Bank |
26,580,610,000 |
1,299,202,000 |
45,067,851,000 |
0.04 |
228,955,000 |
-33,884,222,000 |
| Total |
2,297,381,594,000 |
447,850,652,000 |
4,646,291,239,000 |
17.78 |
184,024,041,000 |
|
| Average |
153,158,772,933 |
29,856,710,133 |
309,752,749,267 |
1.19 |
12,268,269,400 |
|
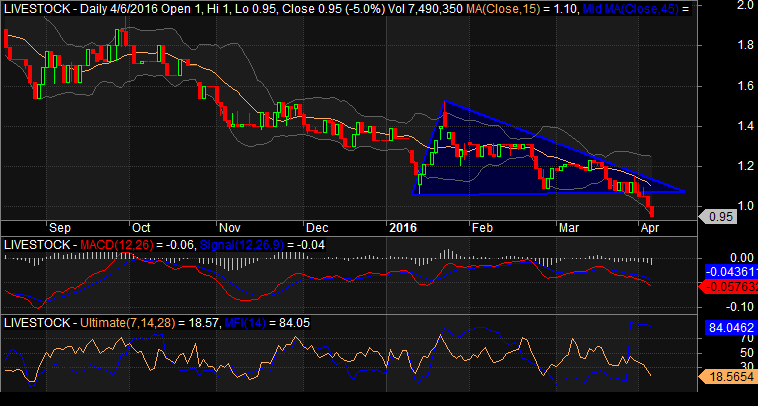
BEST BANKS
ECOBANK TRANSNATIONAL INCORPORATION (ETI)
Market Cap: N292.86 Billion; Net Assets: N528.18 Billion
Current PE ratio: 1.62x; Price/Book value: 0.55
Dividend Yield: %; ROE: 11.44%.
ETI has a multiple bottom looking at the price action of the group, but recently formed a cup and handle pattern which is a strong reversal signal that need to be watched, especially at this time when the market is expecting its earnings any moment from now.
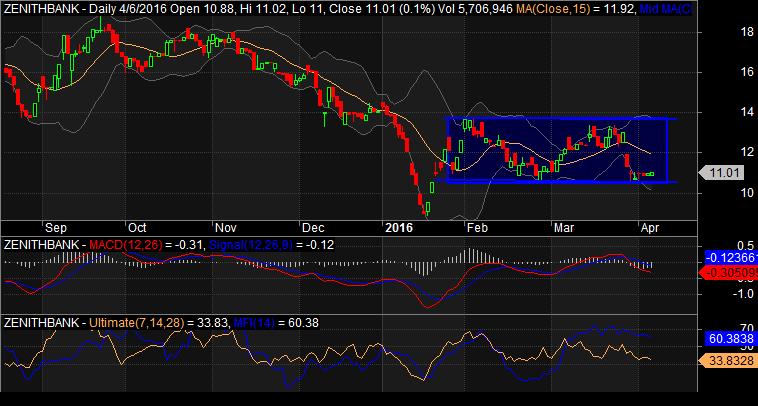
ZENITH INTERNATIONAL BANK (ZENITH BANK)
Market Cap: N356.35 Billion; Net Assets: N571.50Billion
Current PE ratio: 1.43x; Price/Book value: 0.62
Dividend Yield: 15.67 %; ROE: 14.54%.
Zenith Bank has been trending over the years, making highs and lows for traders to make money on the strong fundamental and price performance. In recent time it’s price hit a four-year low of N8.56 before rebounding and now forming a symmetrical triangle that confirms reversals and continuation. The possibility of a break out is high, especially now that the market is expecting its 2015 financials.
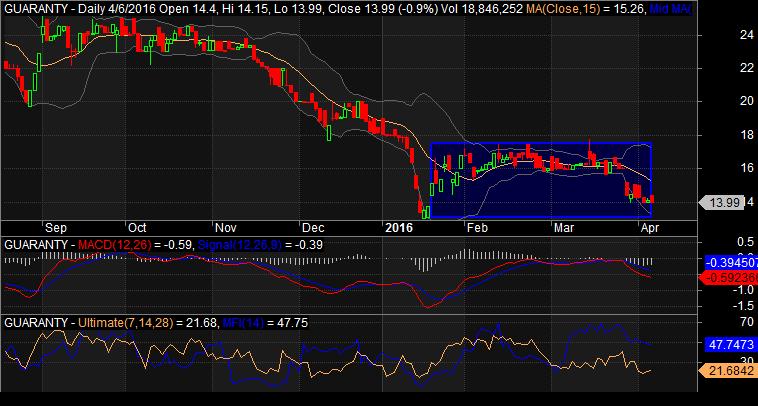
GUARANTY TRUST BANK (Guaranty)
Market Cap: N467.96 Billion; Net Assets: N400.67 Billion
Current PE ratio: 2.08x; Price/Book value: 1.17
Dividend Yield: 9.68 %; ROE: 18.76%.
In the last two years the stock has been trending to recently form a symmetrical triangle pattern that signal reversal and continuation at the same time. An uptrend reversal is possibly at this point and at the same time, there is the likelihood of a break down to continue the downtrend, which is high depending on the market sentiment especially now that the bank’s full year earnings is expected in the market any time this week.
ACCESS BANK
Market Cap: N116.29 Billion; Net Assets: N351.96 Billion
Current PE ratio: 0.81x; Price/Book value: 0.33
Dividend Yield: 8.96 %; ROE: 13.66%.
Access Bank has been trending down, hitting lower lows for the past two years to touch low of N3.56 before moving up a little to find a strong support level of N4.00. At the same time it formed a descending triangle pattern that equally confirms a reversal and continuation that depend on market sentiment or positive market forces.
UNITED BANK OF AFRICA (UBA)
Market Cap: N105.57 Billion; Net Assets: N322.56 Billion
Current PE ratio: 0.72x; Price/Book value: 0.33
Dividend Yield: 3.64 %; ROE: 15.05%.
UBA over the years have been trending down with multiple bottoms to recently form a descending triangle which is either a reversal and continuation pattern. The bank has N2.70 as its strong support level. Market sentiments in the next trading session will determine how far the upside trend would go, especially at this period when the investing community is expecting its full year earnings report.
STANBIC IBTC HOLDINGS PLC (STANBIC)
Market Cap: N142.50 Billion; Net Assets: N117.75 Billion
Current PE ratio: 3.35x; Price/Book value: 1.21
Dividend Yield: 1.95 %; ROE: 11.52%.
Stanbic IBTC Bank has followed the market to trend downward after hitting its all-time high of N35.60 in October 2014. The stock remained bearish, touching a low of N12.32 before reversing to form the current symmetrical triangle which is either a reversal or continuation chart pattern. The possibility of break out is slim as the bank had paid a higher dividend as interim, the full year earnings numbers or reward might not make much impact.
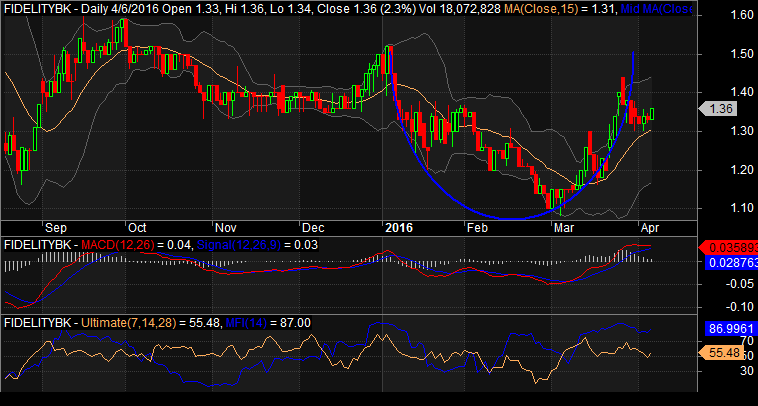
FIDELITY BANK PLC (FIDELITYBK)
Market Cap: N33.03 Billion; Net Assets: N180.34 Billion
Current PE ratio: 0.96x; Price/Book value: 0.18
Dividend Yield: 15.79 %; ROE: 6.35%.
This stock continues to trend, making higher lows and lower lows to have multiple bottoms to break down its strong support levels at N1.16 to a low of N1.14 in the last two years. There were no signald of a reversal at the last trading day of last week. The expected 2015 financials of the bank may reverse the current down trend if the numbers beat market expectation.
Analysis on the banks continued next week. For comments and questions, contact the writer on 08032055467 (SMS only).