Daily Market Update April 6
NSE Composite Index ASI at the point of Break down or Reverse
The nation’s equity market extended it second day rally to gained marginal 10.19 points to close at 25,464.94 from an opening figure of 25,454.75 representing 0.04 percent growth, while the market capitalization was up by N0.39 billion to close at N8.76 trillion. The market during the trading period yesterday was in red before it slightly moved into the green close above the previous close point. The composite index NSEASI year to date returns is currently standing at a negative 11.09 percent while the Market Capitalization for the same period has lost N1.09 trillion.
The market breadth remains under bear control as the number of decliners outnumbered the advancers in the ratio of 21; 14 close yesterday trading. Volume of trades stood at 202million shares in contrast to 177 million shares, representing 14 percent improvement against its previous day trading level while value recorded N885.63 million as against N1.01 billion, representing a decline of 12 percent from the previous trading level. Transactions in the shares of NEM, STERLING, GUARANTY, FIDELITY and DIAMOND topped the activity chart as most traded equities as measured by volume.
The Composite index NSEASI, NSECNSMRGDS and NSEPREMIUM were in the green while other sectorial indices closed in red. The last minutes gain in the share of NB and FBNH pushed the market into green position. Despite the expected first quarter results might not influence the market much due to the prevailing economic situation, investors should target good companies and buy in stages while traders should at the same time use their technical analysis AND other tools to position.
NSEASI DAILY TIME FRAME
NSEASI is currently in a sideway trend in a bullish channel seating on the support line of the channel waiting for a break down or reversal. The symmetrical triangle chart pattern which is a continuation or reversal pattern also confirm the dicey situation of the market. Traders are said to be in an indecisive state as market forces determines break down or out, knowing that response to fundamental good or bad news is usually very sharp. NSEASI closed above the lower band by 18.3%. Bollinger Bands are 67.67% narrower than normal. The narrow width of the bands suggests low volatility as compared to NSEASI’s normal range. MACD is bearish since it is trading below its signal line. The MACD crossed below its signal line 7 period(s) ago. Since the MACD crossed its moving average, NSEASI’s price has decreased 1.06%, and has ranged from a high of 26,026.48 to a low of 25,267.62. RSI is reading 50.80 while other indicators like CCI and Stochastic Oscillator are signaling buy. Also money flow index indicates money entry the market but low at 42.88.
STOCKS TO WATCH TECHNICALLY USING TA
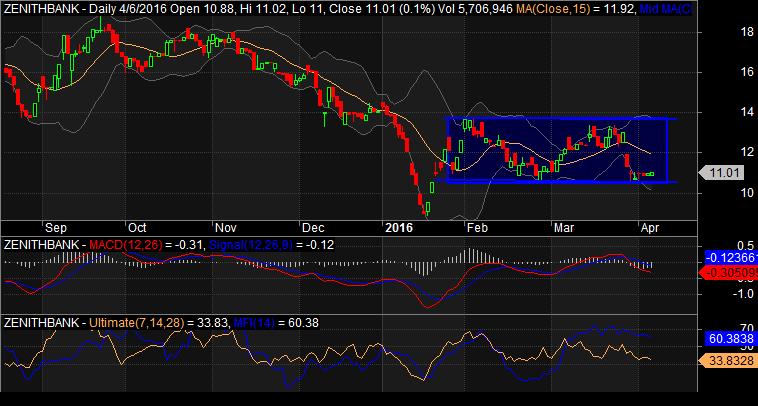
ZENITH BANK
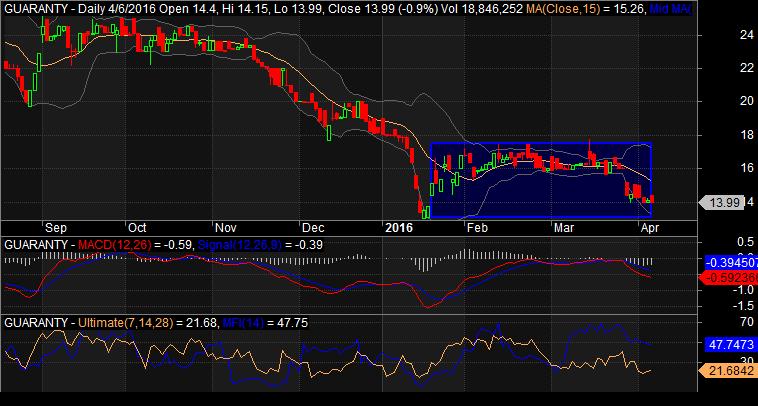
GTBANK
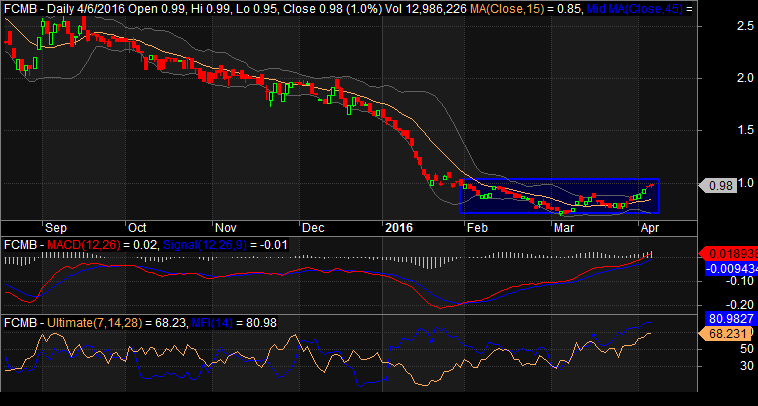
FCMB
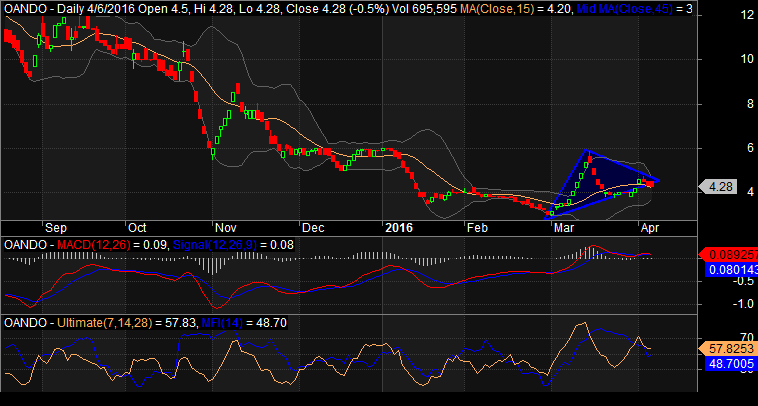
OANDO
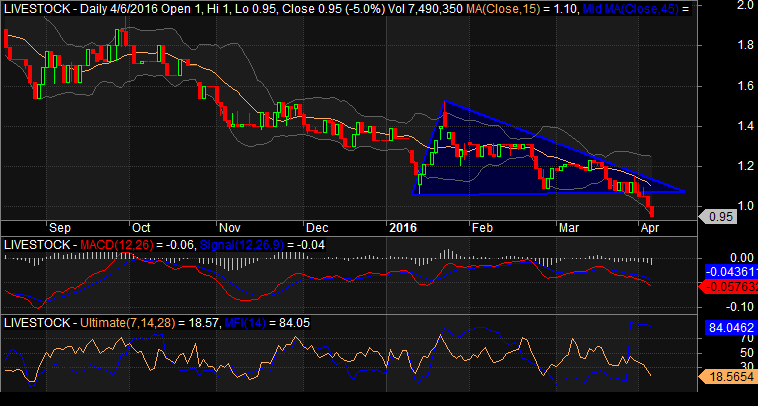
LIVESTOCK FEEDS
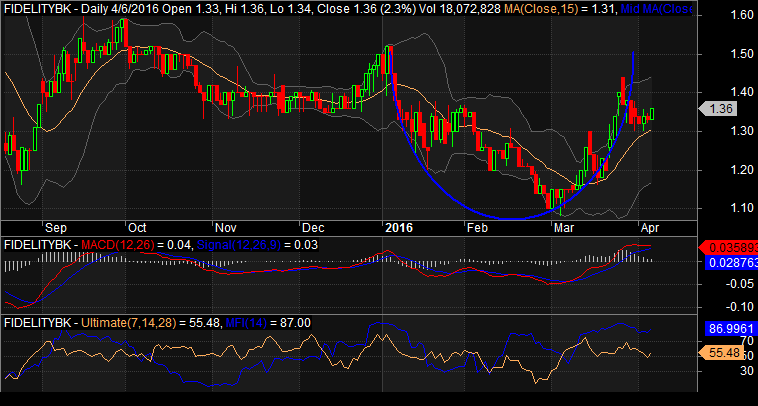
FIDELITY BANK